
 How to resolve AdBlock issue?
 Click, click, click... which click rate is most important for your email campaign?

In the email marketing world we are lucky to have an abundance of click rates to choose from when evaluating our campaigns. Here I want to talk about three of them – and when each is most and least useful.
Definitions
The first is the most commonly used metric in the industry – click-through rate or CTR. It’s calculated by dividing the number of unique (unique meaning one per recipient) clicks by the non-bounce send quantity (send quantity minus bounces). Here’s the written formula:

The other metric commonly looked at is click-to-open rate or CTOR. It’s calculated by dividing the number of unique clicks by the number of unique opens. Once again, the written formula appears below.

The last click metric I want to talk about today isn’t a metric at all. It’s a raw number. It’s the total number of clicks on an email, total meaning that if a single person clicks three times on an email, that counts as three clicks. This differs from the unique click-through rates we feature above; there if a single person clicks three times on the same email it only counts as one click (one click per recipient).

The important thing to know about total clicks on an email message is that it is exactly equal to the amount of traffic sent to the websites featured in your email message. Every click is a visit to a website.
CTR vs. CTOR
There was a heated discussion earlier this year on an email forum (not Only Influencers) about whether it was better to look at CTOR or CTR for your campaigns. I was surprised to see so many people choosing CTOR and dissing CTR as a metric.
They’re both valuable, but you can’t rely on just one in all situations.
For instance…
If you are just focusing on CTOR, which test performed based on clicks?
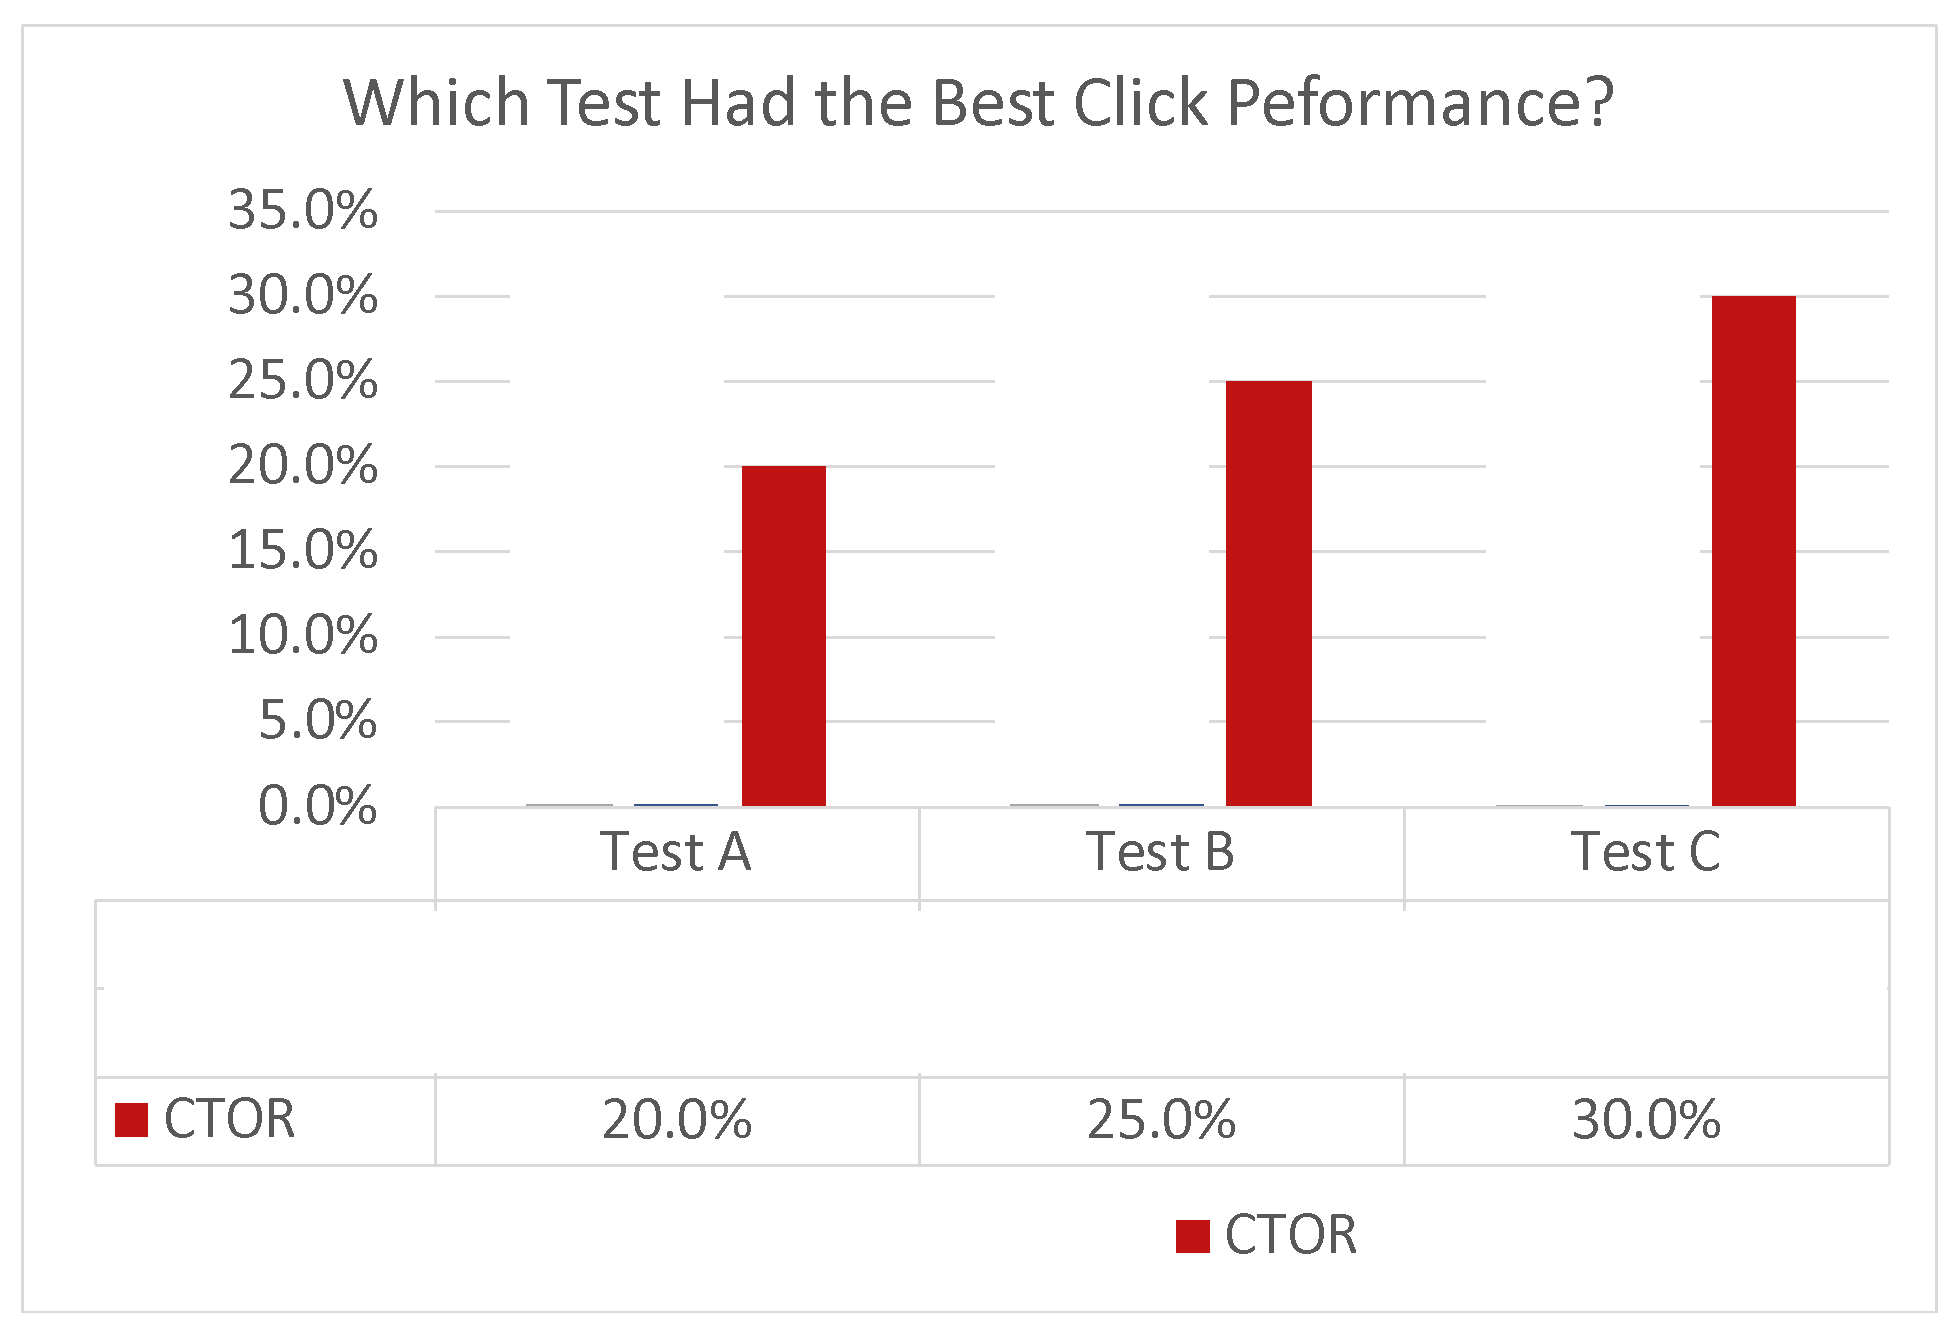
With no other inputs, the answer would be Test C.
But let’s add in CTR.
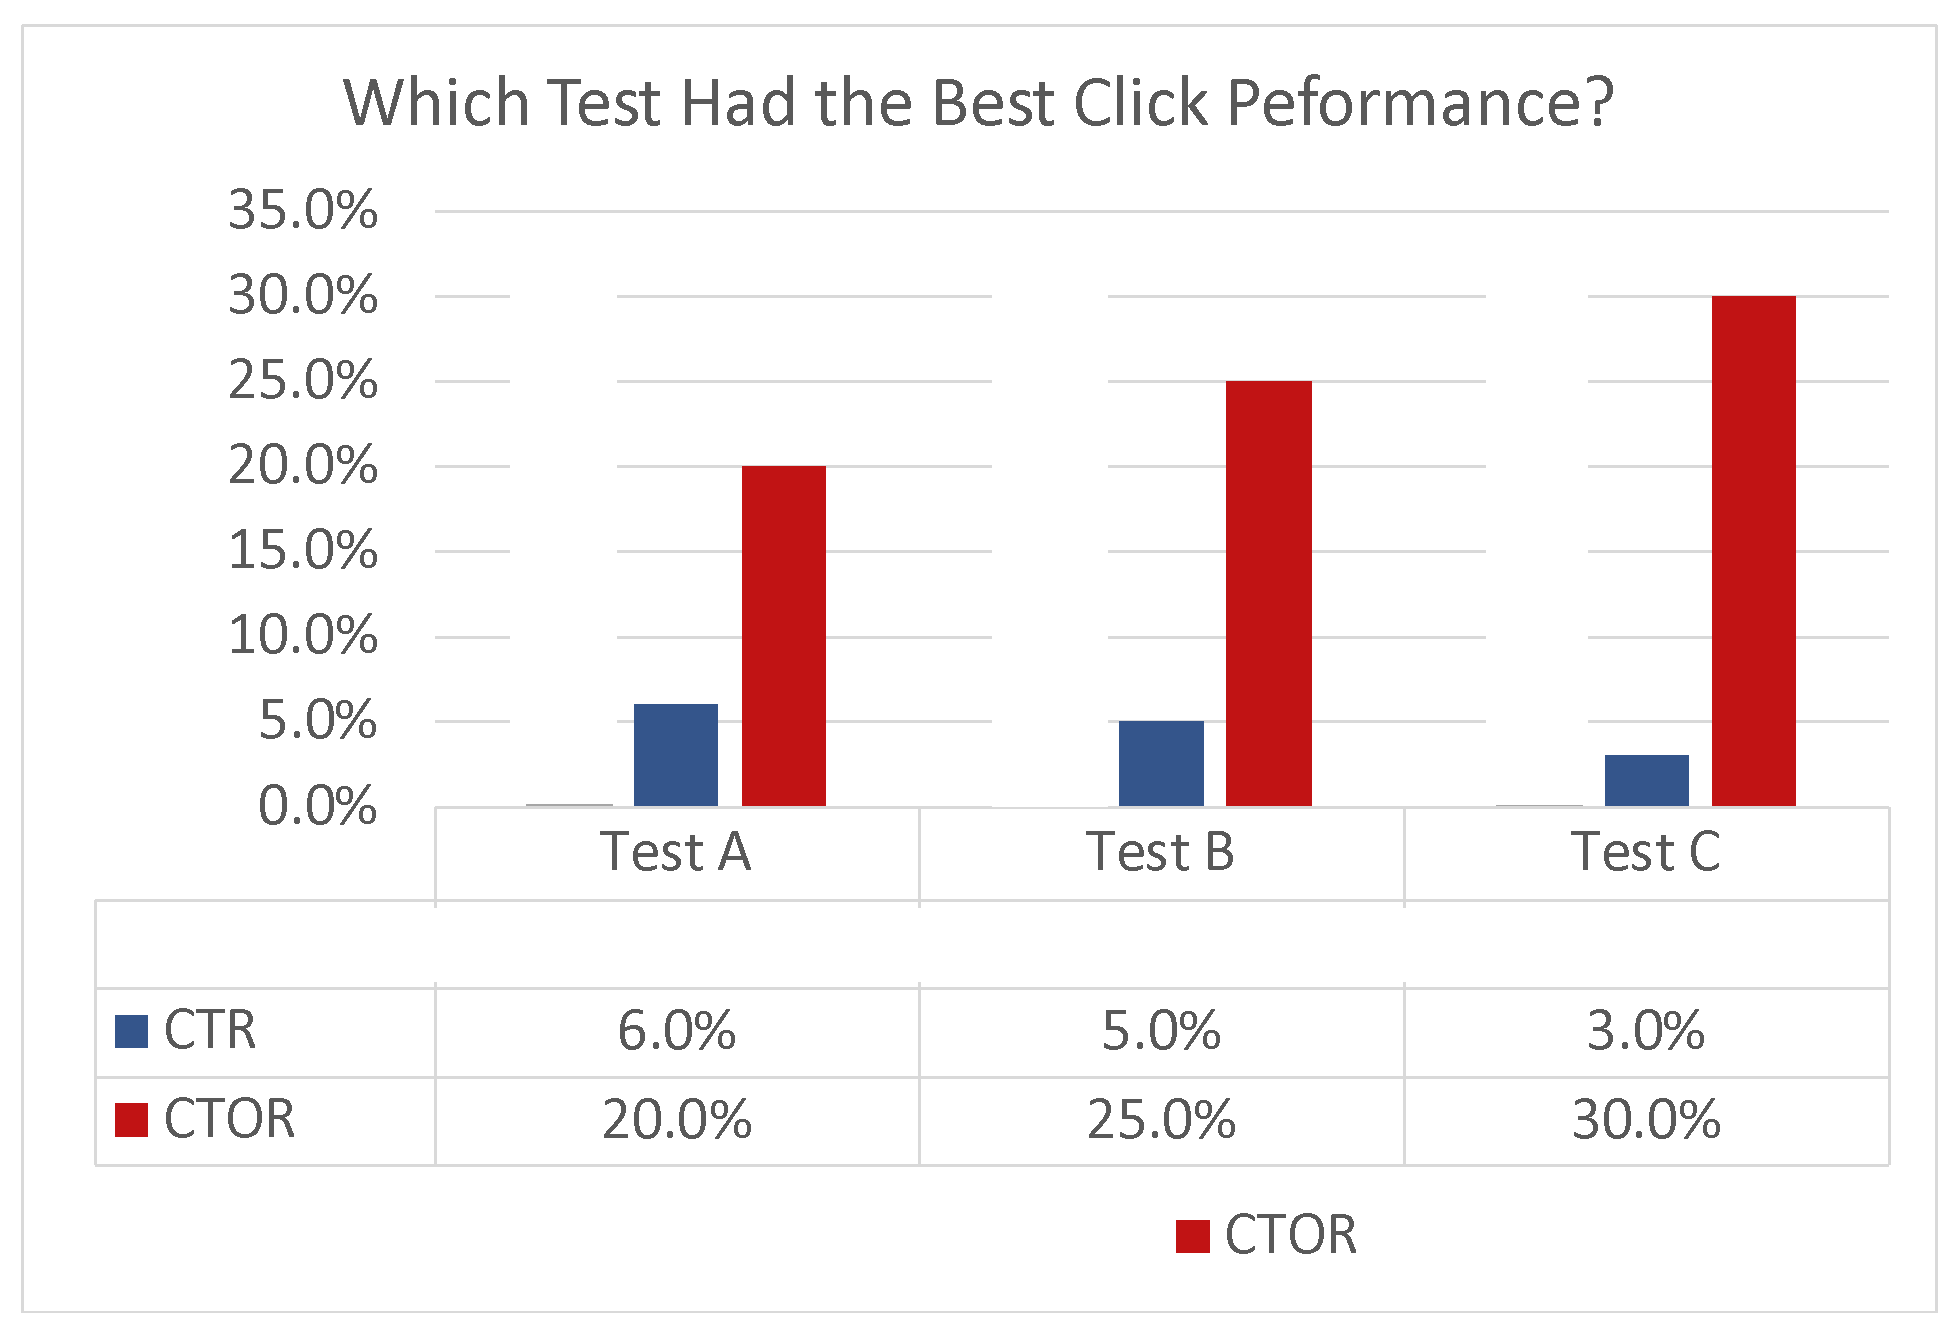
In this instance, Test A had the highest CTR.
How can that be, you might ask? It’s because the Open Rate has a dramatic impact on CTOR, and no impact on CTR.
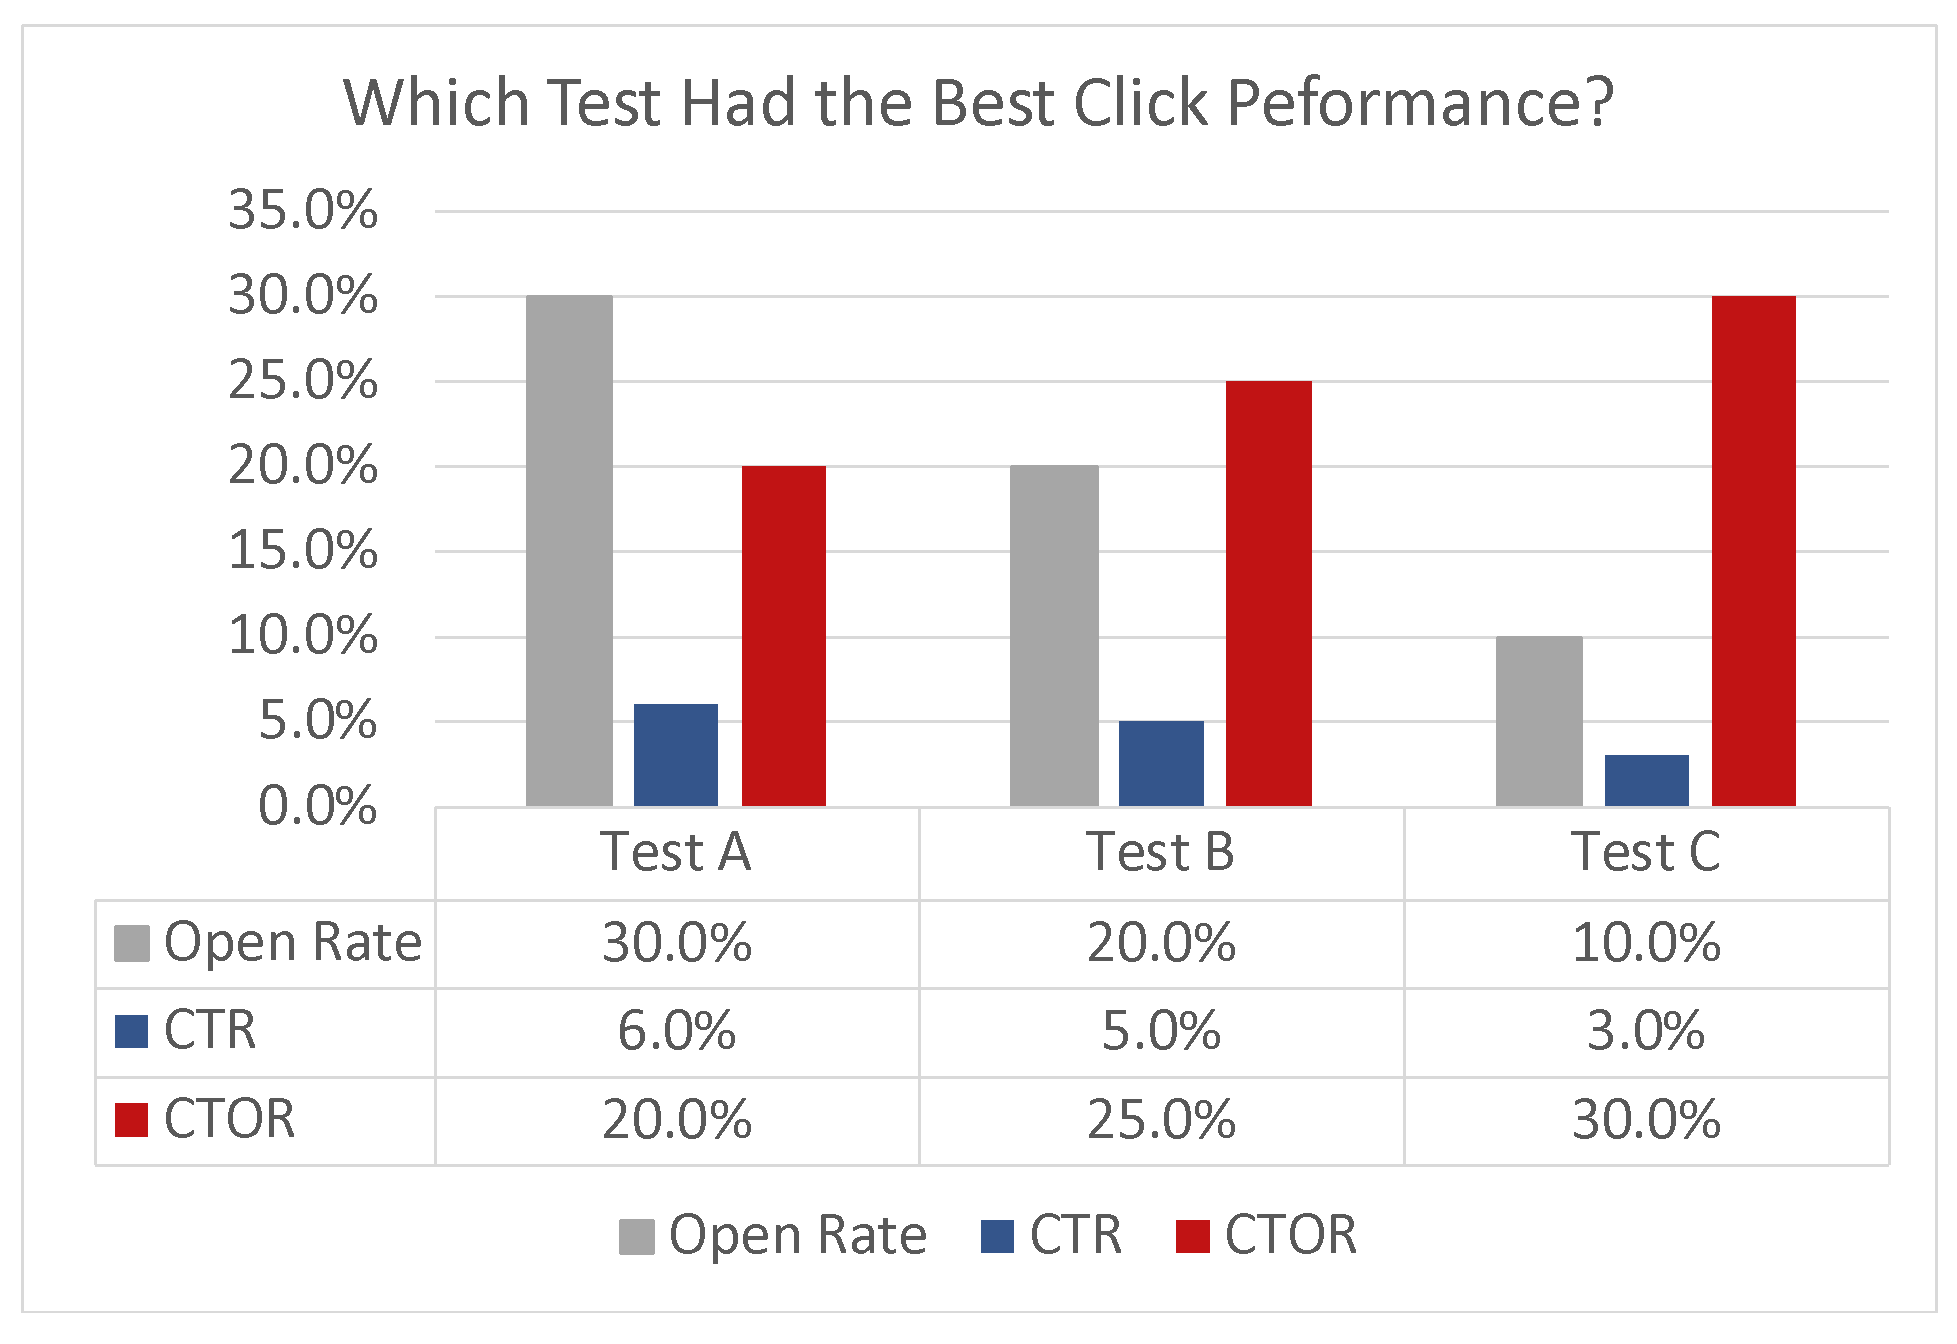
That’s why CTR is a more useful metric than CTOR. It’s an absolute, it’s not dependent on the open.
CTOR can be useful when you are comparing the body of two email messages that have vastly different open rates. But CTOR only gives you a read on the body of the message, not on the overall performance of a message.
CTR vs. Total Clicks
Now just as I’ve convinced you that CTR is usually most useful than CTOR, let me throw a wrench in the works and talk about Total Clicks.
In general CTR is a more useful gauge of success or failure than Total Clicks. Except when it’s not.
Last year I had a client. They had been working with another agency but they wanted a second opinion on what was happening with their email program. Their CTR was good.
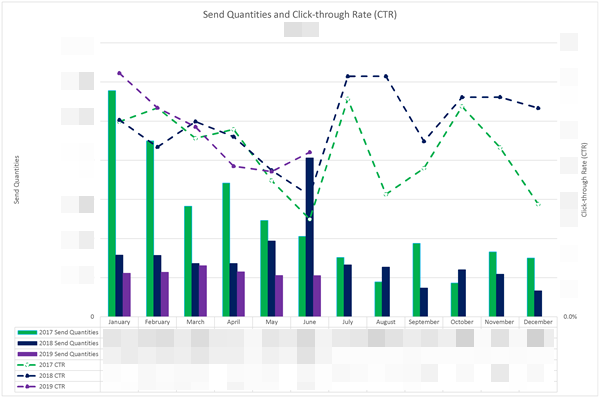
I’ve blurred the numbers for confidentiality, but you can see the trends.
- 2017 metrics are green
- 2018 metrics are navy blue
- 2019 metrics are purple
The bars represent their total send quantities. The dotted line is their CTR.
So their send quantities have fallen dramatically but their CTR has remained relatively constant. For many organizations this would be considered a win, as the level of engagement with their email has not dramatically decreased over time; they’ve kept their list engaged.
Here’s the thing. This organization’s business model is based on referrals. Every link in the email goes back to the organization’s website. Visitors come to their site, learn about the resort destination they represent, and are then passed along to companies providing transportation, tours, activities, hotels, etc. The organization makes money based on how many people are referred to these other sites.
They were confused. Their agency was reporting that all was rosy with email, the CTR was good, but the site was seeing significantly less traffic from the email channel. What was up?
This is where Total Clicks comes in.
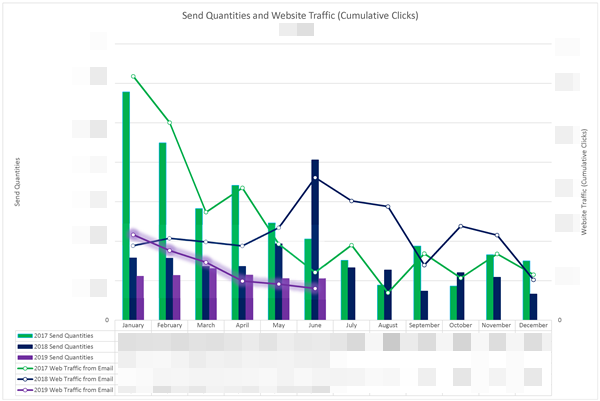
The bars here are the same, showing the send quantities. The solid line shows total, or in this case I called them cumulative, clicks from the email to the organization’s website. As you can see, they are dropping precipitously. I’ve put a halo on the purple line, which was the most recent six months of performance when I did this analysis. After January 2019, each month's total clicks are below previous years and trending downward.
That’s why web traffic is down. But if this is the case, why didn’t we see it in the CTR?
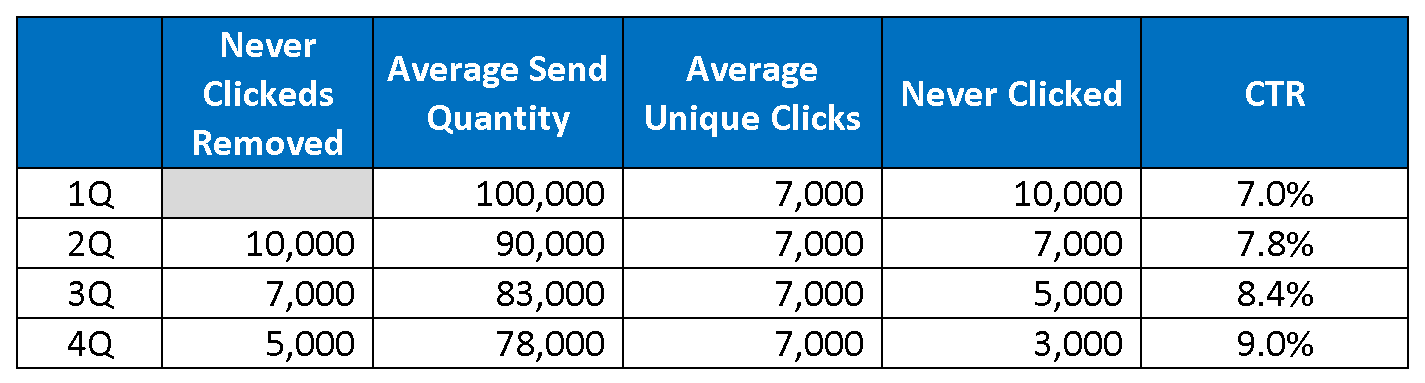
I came to learn that the agency they were working with was aggressively optimizing the CTR metric. One way to do this is to stop sending to people who haven’t clicked on any of your emails recently. Think about it. If you remove those, you decrease your send quantity, and if your average clicks stay the same, you increase your CTR. Here’s an example:
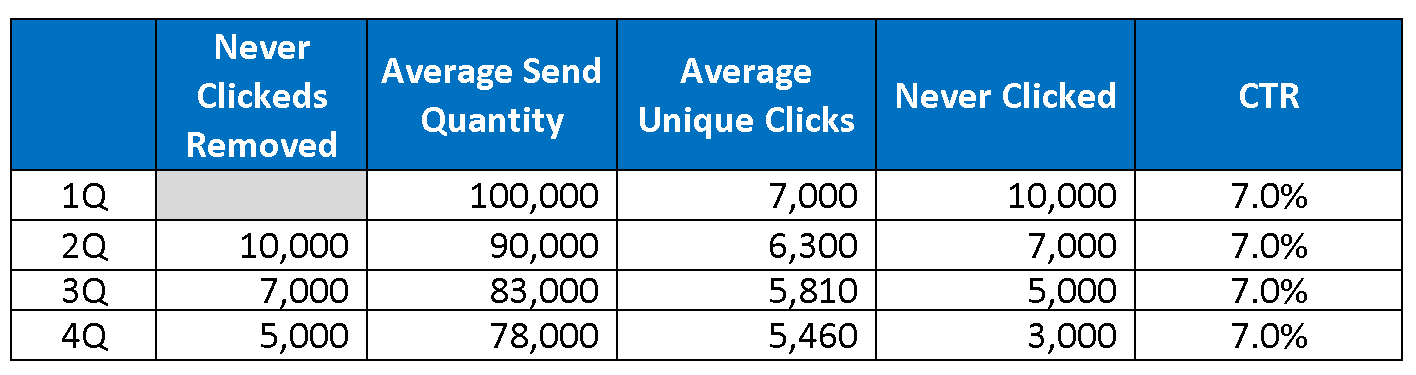
Now, in some instances it’s a good idea to do this. But you need to think about your overall goal. Because this strategy can also mask a decrease in your average clicks, as shown in the example below.
Looking at just the CTR, or even just the CTOR, doesn’t tell you anything about the total clicks, which equals the total traffic driven to the website from the email.
So the drop in website traffic was caused by optimization of the CTR. They were optimizing to the wrong metric, based on this particular client’s business model.
One thing to think about carefully when you are removing people that haven’t clicked recently is what period of time you use. I think that may have been part of the issue here. Think about it. How often do most people take vacations? How often do they go to the same destination?
I think that some of the people who were removed were very interested in visiting this destination again – just not in the near future. I think they liked getting the email messages and seeing what was going on there. But I think they probably only clicked on items in the emails when they were actively planning their next trip there.
Let’s assume, on average, that people visit this destination once every year or two. And let’s say they begin planning their trip three months before their flight. Once they get home, they aren’t actively planning another trip here for 9 to 21 months. So you wouldn’t want to remove people from the list unless it had been more than 21 months since they clicked.
So the next time you’re analyzing your email metrics, think about your business model and which of these click numbers will give you best view of performance for your organization. Let me know how it goes!
About the author

Jeanne Jennings is a recognized expert in the email marketing industry and a consultant who helps medium- to enterprise-sized organizations make their email marketing efforts more effective and more profitable.
She is Founder and Chief Strategist at Email Optimization Shop, a boutique consultancy focused on optimizing bottom-line email marketing performance with strategic testing.
She is also General Manager of the Only Influencers community of email marketing professionals and Chair of the annual Email Innovations Summit in Las Vegas.
Her client list includes B2B, B2C, government and non-profit clients including AARP, Capital One, Consumer Reports, Hasbro, Museum of Science: Boston, National Education Association (NEA), New York Times, UPS, US General Services Administration (GSA), and Verizon.
Jeanne is an adjunct professor at Georgetown University, teaching digital marketing to students earning their Masters in Integrated Marketing Communications from the School of Continuing Studies. She also leads industry as well as private workshops on email marketing topics.
Her book, The Email Marketing Kit: The Ultimate Email Marketer’s Bible, was published by SitePoint; she is a regular contributor to her own Email Optimization Shop blog as well as the Only Influencers blog.
Jeanne is based in Washington, DC, she earned her MBA from Georgetown University (Hoya Saxa!), and she is an avid hockey fan (Let’s Go Caps!).