
 How to resolve AdBlock issue?
 How predictive analytics can help you grow your email program

If you read my previous Only Influencers posts on analytics for email marketers and finding the right predictive features for your program, you'll discover I'm all about asking questions – specifically, asking the right questions.
Asking the right questions helps you figure out what's not working in your email program and what you have to do to fix it. These questions can help you pinpoint the areas where your program is failing and help you set up plans to make improvements.
Right now, as you plan to grow your program, you might be asking yourself questions like these:
- "How can I connect better with my subscribers?"
- "How can I improve my subscribers' experiences with my email program or my brand?"
- "How can I shape my content and offers to match what my subscribers need?"
Of course, the question you really want to ask is "How do I make more money?" That's totally legitimate because you have sales or revenue targets to hit.
But again, you need to back up and work your way through more fundamental questions that address engagement, user experience, churn and other factors to discover what's really affecting your bottom-line performance.
Reporting can help you answer your questions -- but often standard reports don’t show the whole picture
Now that you have your questions, where do you go to get the answers? Unfortunately, often it's harder than you think! And it isn't because you're clueless – in fact, because there is so much data available to us as email marketers, we can get overwhelmed by data quickly and find ourselves in analysis paralysis.
Email generates all kinds of reports, whether they're campaign-level or one-off reports or automation and sequence reports. Most of these reports fall into the category of descriptive analytics. They describe what happened in the past. Most email platforms generate these reports automatically now. This is fantastic because we have access to an overview of our data in a few clicks.
However, these descriptive reports have one big drawback. They don't give you the whole picture. They tell you what happened but not what to do with the data to figure out your next steps. For that you need to move up to predictive analytics.
Descriptive and predictive – what's the difference?
Before I go any further, I'll stop for a quick refresher on how descriptive and predictive analytics can help you ask the right questions and guide you to the right solution path.
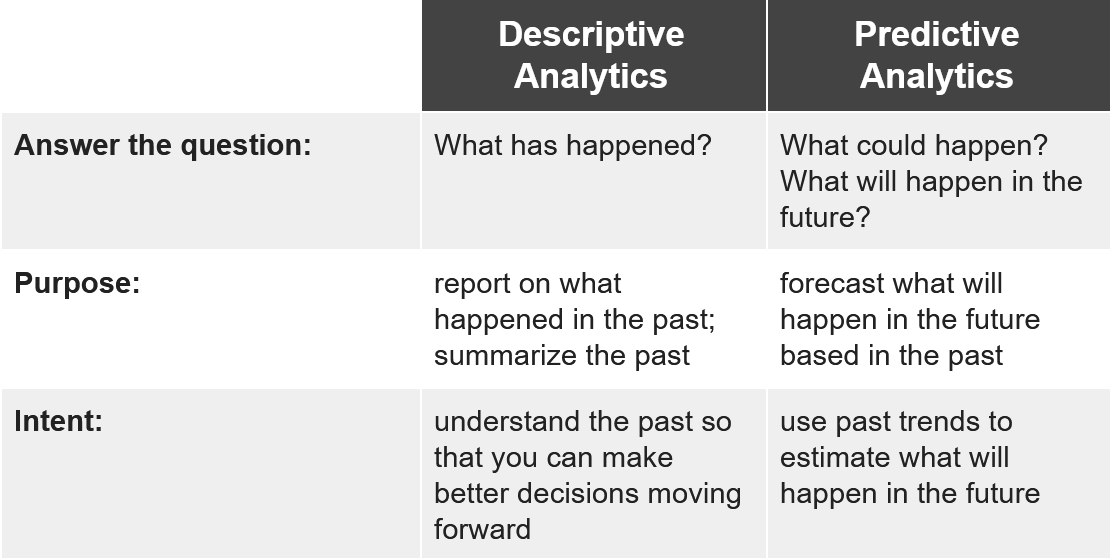
The descriptive analytics and reporting about your campaigns and automation sequences are helpful because they show you what happened -- but you must identify patterns, trends, and unusual occurrences -- and select your next steps. Bummer!
Alternatively, predictive analytics makes it easier and faster to identify your next steps and understand the underlying patterns and trends in your data.
Using predictive analytics and reporting can help you improve your program
Predictive reports provide insights on relationships in your data you may not be aware of and provide an estimate (e.g., a prediction) for what may happen in the future. Those types of insights aren’t possible with descriptive reports.
Predictive analytics and predictive reporting can help you answer these questions by identifying key customer segments or content types like these:
- Contacts on your list who are most likely to purchase. Example: Predicting who is most likely to purchase in the future, using data about who purchased in the past
- Existing paying customers who are most likely to churn. Example: Predicting who is most likely to churn in the future, using data about who canceled in the past
- Content that would be the best fit for your contacts. Example: Predicting the content most likely to persuade people to convert, such as product recommendations, using data about what content converted in the past
A robust predictive report has two parts:
Part 1: Prediction -- this is the forecast about the future (e.g., the contacts that are most likely to purchase or churn or the content that is most likely to convert). Think of this as the "what or who" is best to focus on in the future based on the data analyzed.
Part 2: Attributes Summary -- a list of the attributes considered and they impact the forecast. This helps you understand the key attributes that are common across your buyers, churners or high-converting content.
Think of this as the "why"; the attributes summary gives you insight on how the prediction was made.
What you can do with your predictive report:
What would you do if you knew who was most likely to purchase and why? Or what would you do if you knew what content converted the best? Probably many exciting ideas come to mind!
For my clients, I typically see predictive reporting inspire program-improving action in three ways:
- Reconnecting, such as creating a new promotional campaign or revamping a reactivation program
- Sending a related offer or other content
- Crafting or improving the customer experience, such as inviting the customer to update a profile or join your loyalty program
How to access predictive reports for your program
There are data scientists, like me, that will happily generate predictive reports about your program.
In addition, several email service providers do the number-crunching for you, such as Mailchimp's Customer Lifetime Value and Purchase Likelihood report and Listrak’s Predictive Modeling in CRM.
Final thoughts
As I've shown here, asking the right questions is the first step to finding the right answers – the ones that will help us create a new program, correct a program that's going off course or discover underlying weaknesses that prevent our email programs from driving all the sales and engagement they could.
Using the historical data from descriptive analytics is a start. But we can upgrade our understanding of our data (and our email programs) by moving beyond descriptive analytics to predictive analytics and reporting.
 Photo by Austin Distel on Unsplash
About the author
 Dr. Ada Y. Barlatt, Ph.D. is the Founder and Chief Analytics Officer at OperationsAlly. She helps her clients discover and leverage insights hidden within their ESP data. She loves when her clients start to see their data is a representation of the real lives they impact (instead of just a bunch of numbers). When she isn’t working with clients, you could find her on a cruise ship (pre-COVID) or watching anime (post-COVID). She loves self-assessments, laughing and gluten-free baked goods!
Website: www.operations-ally.com
LinkedIn: linkedin.com/in/adabarlatt
Instagram: http://instagram.com/adabarlatt