
 How to resolve AdBlock issue?
 Where It's At on Opens by Mailbox Provider

The only right answer to ‘what is a good open rate?’ or ‘what should my open rates be?’ is: ‘it depends’. It’s also a lazy and useless answer when left at that because it ignores all the important contextual factors and provides no information. The truth is that if you are consistent in how you collect and measure the data, your open rate can be a good indicator of performance - especially relative to your own historical performance.
So it’s important to be able to ask the ‘how am I doing?’ question with a couple different flavors:
- How am I doing against my own historical performance - are others seeing the same trends, or absent that, am I responsible for the changes?
- Are the differences I see between mailbox providers typical for other senders (i.e. ‘has Microsoft gotten more aggressive in adding to my emails to the spam folder, thus causing a downhill effect on opens, or is it just me?’)
With that in mind, let’s get to the fun part and look at some data. We’re fortunate to have an extremely large footprint of data that allows us to review the performance of senders and inboxes across over half a trillion data points from the past year.
Using this data, we can look at the typical unique open rates for senders over the past 12 months. The gray bands indicate the interquartile range of the observations:
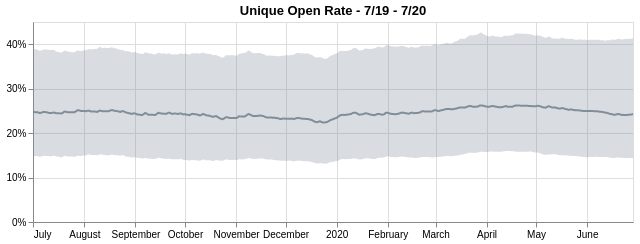
We can see here that overall unique open rates have been extremely flat over this time, with a very mild lift in the post-COVID quarantine world.
Following up on a line of discussion I had with Tamara Bond in the upcoming Email, Duh! Video, I wanted to dig in and really understand how this varies by provider. We’ll concern ourselves with Gmail, Gsuite, Verizon Media Group, Microsoft and Apple which constitute over 80% of recipients for most senders. For these providers we note that open rates have been largely consistent over the past 12 months (with a usual holiday dip around the holiday season), with the exception of Microsoft, which took a noticeable downturn in the late summer of 2019 and which has not made a full recovery. This has been reported anecdotally by a number of people in the email community and is likely due to an algorithm change at Microsoft.
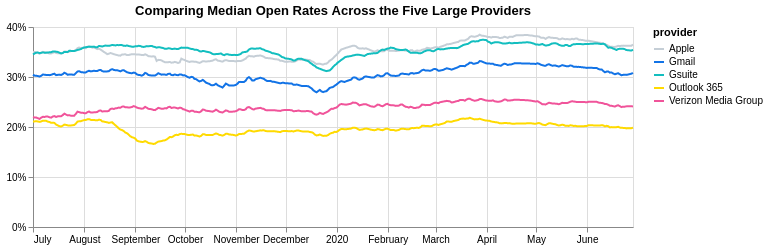
Of notable interest here is that while open rates remain largely flat - different providers have different median open rates, with Apple and Gsuite being the most highly engaged user bases and Verizon and Microsoft being the least engaged, by a material amount.
If we dig further, we can look into how big the spread of the open rate distribution is for these providers. Here we’ll exclude outliers and look at the interquartile range of open rates by provider and contrast Apple and Microsoft and see this consistent behavior where Apple recipients are more than one and a half times as likely to open email as an Outlook 365/Hotmail recipient.
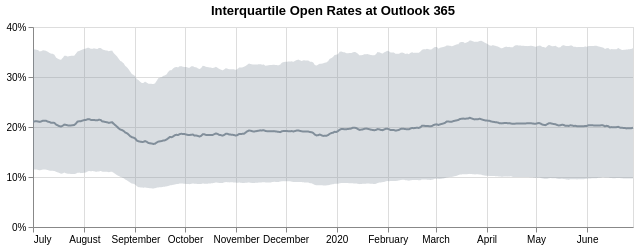
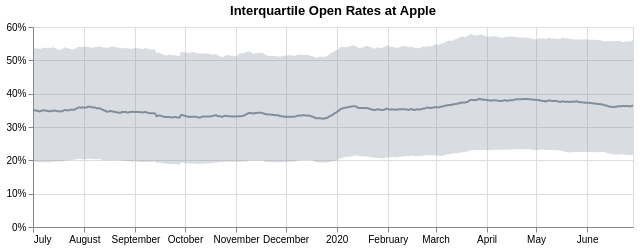
We believe that this is largely due to the demographics of the providers’ user-bases, with Microsoft and Verizon having a large number of ‘legacy’ users while Apple continues to acquire market share there. The GSuite vs GMail divide is explained by users who pay for their email or subscribe at work addresses (GSuite) being more engaged than those who don’t.
What this all means for you largely depends on how you run your sending program. In general though, it means that you should:
- Put your efforts on things that work and are growing. Gmail is a huge portion of senders lists and so it’s worth optimizing.
- Expect that recipients at different mailbox providers will behave differently and adjust your own expectations for campaign performance accordingly.
Some notes about methodology: we’ve found in our research that a very small number of recipients engage in non-human interaction (NHIsi.e. bots), but those that do often generate a large number of clicks and opens. The easiest way to accommodate for that today is to only consider unique engagements from users, vs the raw open or click rate. This helps minimize the impact of non-human inboxes to a minimum in your reported stats. We’ll have more to say on the SparkPost blog about our research on NHIs in the near future.
About the author
 George Schlossnagle is a Co-Founder, Distinguised Engineer, and a Member of the Board at SparkPost (recently acquired by MessageBird). George has been working in email since 1999, when he and his brother began developing what would become the Momentum mail transfer-agent at OmniTI. Following the spin-out of SparkPost from OmniTI in 2008, George held the roles of CEO and CTO before moving into his current role in 2020. Through the expansive Momentum on-premises footprint and his role moving SparkPost into the cloud, George has overseen the evolution of enterprise-grade email sending and analytics over the past two decades.
George is an active participant in the global email community as well as a supporter of the Baltimore-area businesses, currently serving on the board of Circonus. George holds a patent for a method and system for adaptive delivery of digital messages. He received a BA and MA in Mathematics from Johns Hopkins University and his MS from Brown University.
In his personal time, George enjoys cooking, backpacking and spending time on his Maryland farm with his wife Pei, their two children and their many beloved animals.