
 How to resolve AdBlock issue?
 Custom Fields and Tags: Your Key to Next Level Email Marketing Analysis

We know that the key to measuring success with any type of marketing is to track relevant metrics and adjust practices accordingly. But are you taking advantage of all of the data in your email marketing account?
Most email marketers are used to analyzing key metrics about opens and clicks within their campaigns. However, there are other data points in your email service provider (ESP) that you can consider to understand the performance of your program -- custom fields and tags.
The rest of the post shares how you can analyze the custom fields and tags applied to better understand your subscribers and their behavior.
Custom Fields and Tags in Email Marketing - A Quick Overview
Let’s start with the basics. Custom fields and tags are simply ways to organize data. You can think of them as file folders in a digital filing system. Actually, you’re likely already using custom fields and tags for personalization or email segmentation and to keep your databases organized. But you can also use them for email marketing analysis (more on this in the next section).
Both custom fields and tags go by different names in different email systems. For instance, Mailchimp calls “custom fields” “merge fields.” As you are personalizing emails, you have probably used a special notation like *|FNAME|* or {{First_Name}} to tell your email system to insert the reader’s first name into an email.
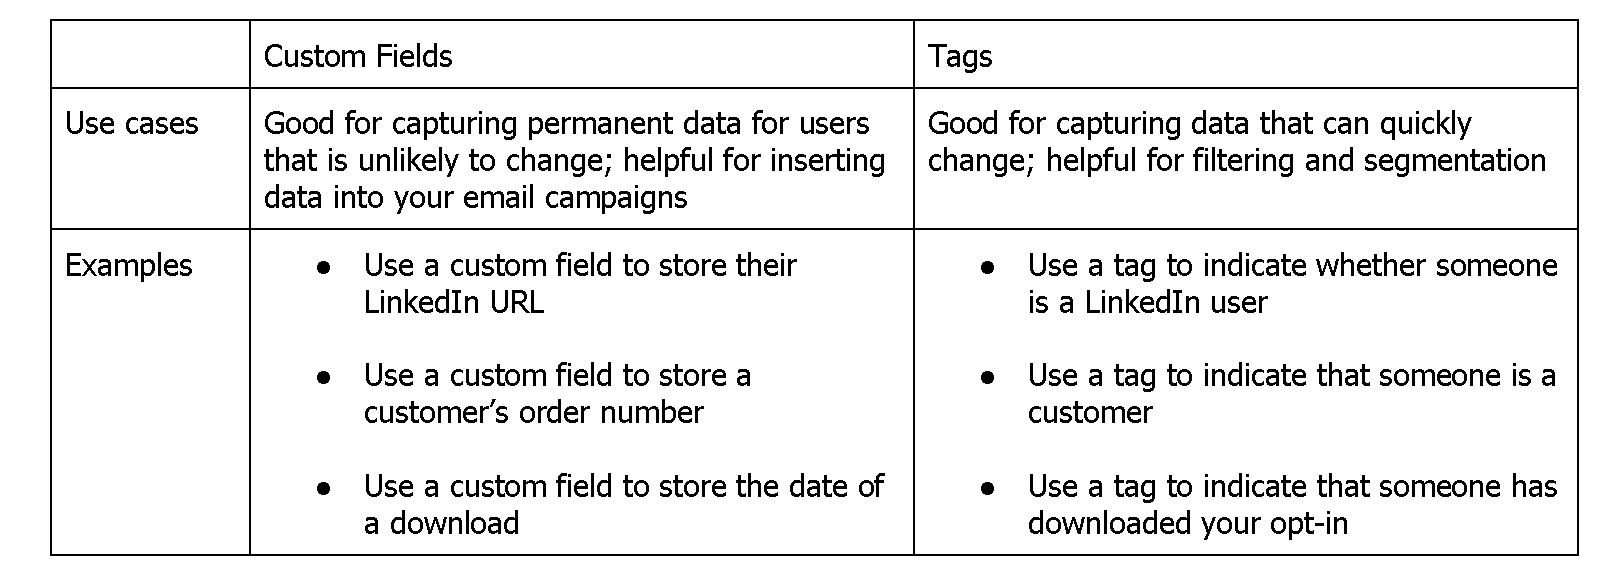
While there is some overlap in what custom fields and tags can do, here’s a chart to help you compare and think about when to use them with your contacts:
Analyzing Custom Fields and Tags
Okay, so now that you understand the basics of using custom fields and tags, let’s look at some specific examples demonstrating how to incorporate them into your email analytics roadmap.
One of the best uses of custom fields is to re-create timelines of subscriber engagement to learn what is working and what can be improved. Take a look at the following two examples.
Example 1: Suppose you want to know in what order potential clients access your content so that you can find trends and use the information to shorten the sales cycle.
You can set up a custom field to store the most recent download date for each of your PDF opt-ins or white papers. You can then start asking and answering questions like:
- What do people most often download before converting from prospect to client?
- What are the trends?
- What is the typical path of a person who enters the funnel through a specific freebie (e.g., an opt-in, special offer, or white paper)? Is their journey similar or different from other prospective clients?
Whether or not you’ve explicitly defined your preferred customer journey, this data can help you understand your customer better. If they’re skipping over a piece of content and missing crucial information that could move them toward making a purchase, you will want to know this, so you can figure out how to share information at the right time.
Note: You can use tags to track what content has been downloaded, but I find it much more powerful to have the date in a custom field. When stored as a custom field I find the data to be easier to organize and analyze for trends.
Example 2: Suppose you sell multiple different products and you are curious about how often people purchase the same set of products (or what sets of products people typically purchase together).
You can use tags to see the frequency of products purchased together. There are fancy ways to do this analysis (using complex algorithms) that identify all possible combinations.
However, the simplest way to understand the overlap is to count the frequency of specific pairs (or sets) of tags occurring together. Using tags in this way can provide huge insights such as what products or services customers typically purchase over time
- To discover this, search for the number of people that are tagged with a product A purchase are also tagged with a product B purchase
You can also use this type of tag analysis to understand other behavior like the proportion of clients who attend free events repeatedly without making a purchase
- To discover this, search for the number of people that have more than one free event tag, but do not have any purchase tags
You may have thought that you needed to go to your ecommerce reporting tool or payment processor to collect this information, but with a solid tagging and custom field strategy you can do this type of analysis all within your email service provider (ESP).
How to Get Started with Custom Fields and Tags
Getting started with custom fields and tags is easy. The best part is you don’t have to be a data scientist to understand these metrics and how to use them to optimize your email marketing.
Just follow these simple steps:
1. Familiarize yourself with how custom fields and tags work within your ESP.
Not every email service provider (ESP) uses the same types of fields. You may see, for example, dropdowns, text inputs, bullet points, dates, etc. Also, the way to go about searching for data in your database will differ depending on which ESP you use.
You will want to familiarize yourself with what’s available and how these data work. Consider what would be most useful given the ways you currently analyze data. Most ESPs allow for integration of other data visualization tools or Application Programing Interfaces (APIs).
2. Consider what you want to know.
Remember that your data is only as good as the questions you ask. Once you familiarize yourself with how these data collection tools work, you can decide what data points answer key questions.
Your email marketing metrics should connect with your wider business goals. So start there. What information do you need to get you closer to your goals? What custom fields and tags will help you gather that information?
3. Set a naming convention.
This one is especially important if you have a larger team working on email marketing and analysis with you. You want to make it easy for anyone on the team to glance and grab pertinent information they need to accomplish specific goals.
When I did this with a client recently, we had a multi-part naming convention for tags and set key custom fields that the team needed to create (e.g., the download date of key opt-ins, and the purchase date of key products).
4. Test your naming convention based on your questions.
Above, I mention that it is important for you to ask the right questions to get the data that’s most useful. After you set a naming convention, ask yourself, “if I had this data (from the tags and custom fields) what queries or searches would I conduct to find the answers to my questions?”
Often you can detect errors in naming conventions using this quick mental exercise.
5. Implement a standard process and communicate the naming convention.
The naming convention is a key part of the marking process. Unless everyone on the team uses the same naming convention, you won’t be able to analyze your data accurately. So, leaders must insist upon a standard naming convention and communicate it to their teams.
If you haven’t been using a standard convention, then you may need to go through a conversion process (updating your old tags and custom fields to the new format). It may feel tedious at times, but getting this done will be worth it. The insights that you gain from a well organized database are unparalleled!
6. Analyze.
Once you’ve started to collect the data, it’s time to put that data to work. Analyze what you have to learn more about your audience. Remember if the information you’ve collected is not answering your questions, you can modify the naming convention or process as needed.
Analyzing custom fields and tags on their own (or in conjunction with click data) can be a fantastic way to take your email marketing to the next level. It may take some time to really understand what your data is telling you. But with patience and persistence, you will gain access to critical information you can use to grow your email list, sell more products, and convert prospects more quickly!
Photo Source: Pixabay (https://pixabay.com/photos/analysis-analytics-business-charts-1841158/)
About the author
 Dr. Ada Y. Barlatt, Ph.D. is the Founder and Chief Analytics Officer at OperationsAlly. She helps her clients discover and leverage insights hidden within their ESP data. She loves when her clients start to see their data is a representation of the real lives they impact (instead of just a bunch of numbers). When she isn’t working with clients, you could find her on a cruise ship (pre-COVID) or watching anime (post-COVID). She loves self-assessments, laughing and gluten-free baked goods!
Website: www.operations-ally.com
LinkedIn: linkedin.com/in/adabarlatt
Instagram: http://instagram.com/adabarlatt